
7 Ways to Stand Out and Secure Your Next Data Analytics Role
Tips for getting hired, creating a free data visualization portfolio, connecting with other data enthusiasts, landing your dream data viz job, and more.
 Tableau Public
Tableau Public’s Viz Wrap: Data Visualizations from 2023
 Explore a curated collection of compelling data visualizations crafted by the DataFam on Tableau Public this year.
 Tableau Public
A Beginner's Guide to Tableau Public
 A step-by-step guide to get you started on your own data viz journey.
 Tableau Public
Featured Authors: Hispanic Heritage Month Edition
September 21, 2023
Connect with this cohort of Featured Authors as we celebrate Hispanic Heritage Month. Tableau Public
27 Data Visualizations to Gain Insight into Global Literacy
 September 8, 2023
Learn about the complexities and nuances of literacy rates around the world through this gallery of visualizations created in Tableau Public.
September 8, 2023
Learn about the complexities and nuances of literacy rates around the world through this gallery of visualizations created in Tableau Public. Visualizations
Touchdowns and Trends: College Football Through Data Visualization
 September 2, 2023
Heated rivalries, conference realignment, stadium capacity, fan maps, game predictions and more. Explore the data visualizations on all things college football.
September 2, 2023
Heated rivalries, conference realignment, stadium capacity, fan maps, game predictions and more. Explore the data visualizations on all things college football. Tableau Public
Find Tableau Experts Open to Work on Tableau Public
 August 22, 2023
Looking to hire a data analyst? This dashboard allows you to search based on your job requirements and connect with Tableau Public authors who are avaliable.
August 22, 2023
Looking to hire a data analyst? This dashboard allows you to search based on your job requirements and connect with Tableau Public authors who are avaliable.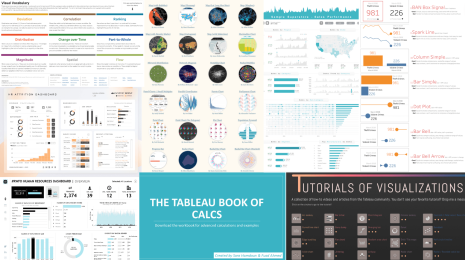 Tableau Public
8 Most-Favorited Data Visualizations on Tableau Public
July 27, 2023
With more than 8 million data vizzes now on Tableau Public, explore the most-favorited vizzes of all time and the authors who shared them. Tableau Public
Featured Authors: Celebrating 3M Profiles on Tableau Public
June 29, 2023
We’re excited to introduce the new cohort of Featured Authors who are part of the more 3 million profiles and 7 million vizzes on Tableau Public. Get to learn more about them and explore their notable portfolios. Tableau Public
Celebrating Tableau Public Vizzes and Creators at TC23
May 25, 2023
Tableau Public is one of the best ways to quickly connect with the DataFam and this really comes to life at Tableau Conference. Iron Viz
2023 Iron Viz finalists made earth their viz-ness at Tableau Conference
 May 19, 2023
Three data whizzes took the Tableau Conference keynote stage, but only one was crowned 2023 Iron Viz Champion. Get the recap on this year’s ultimate visualization showdown.
May 19, 2023
Three data whizzes took the Tableau Conference keynote stage, but only one was crowned 2023 Iron Viz Champion. Get the recap on this year’s ultimate visualization showdown. Iron Viz
Tableau's Iron Viz Winners
A collection of the winners' visualizations of Tableau's Iron Viz Championship. Iron Viz
Meet the Iron Viz 2023 Finalists
May 2, 2023
Get to know the 2023 Iron Viz Finalists Brittany Rosenau, Nirosh Perera, and Paul Ross.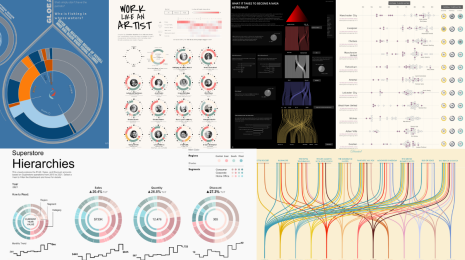 Tableau Public
Exploring Sankey and Radial Charts with the New Chart Types Pilot on Tableau Public
 April 21, 2023
Discover best practices for using two new chart types—Sankey and radial— on the Chart Types Pilot on Tableau Public.
April 21, 2023
Discover best practices for using two new chart types—Sankey and radial— on the Chart Types Pilot on Tableau Public. Tableau Public
Celebrating the DataFam and 3 Million Tableau Public Profiles
March 21, 2023
With more than 3 million profiles and 7 million vizzes, Tableau Public is an engaged and growing community of data enthusiasts creating the largest repository of interactive data visualizations on the web.
Subscribe to our blog
Get the latest Tableau updates in your inbox.