The Power of a Metrics Layer—and How Your Organization Can Benefit From It


The true value of data lies in the insights it reveals. The trick is providing insights with the right business context to the people who need them to make sound business decisions. That’s where a metrics layer comes in. To help deliver on-target insights, a metrics layer gives analysts the capability to build a business glossary of metrics or KPI definitions that can be used across the organization.
Because it enables analysts to bring insightful new experiences to their stakeholders and data into every corner of the organization, the Metrics Layer is a critical component in Tableau Pulse powered by Tableau AI,
What is a metrics layer?
A metrics layer allows an organization to standardize its metrics and how they are calculated. It builds a single source of truth for all metric or KPI definitions for all data sources in the organization. A metrics layer sits on top of the data sources and powers consumption tools for business users. The metrics layer defines:
- The key metrics that matter most to users
- What the data represents, including semantics such as whether an increase in the data is favorable or not
- How metrics relate to one another
In Tableau Pulse, the Metrics Layer can understand the underlying business semantics associated with user’s queries. This in turn powers the Tableau Pulse Insight platform to better answer the “what, why, and so-what” questions business users pose when asking for a specific metric.
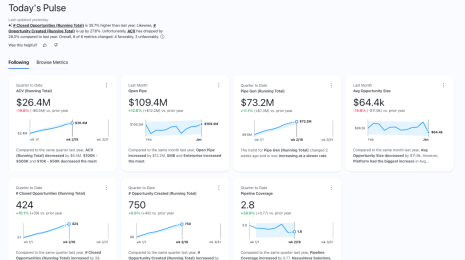
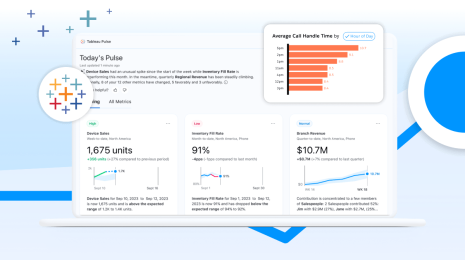
Tableau Pulse Metrics Layer
In order to be successful, a metrics layer needs to be secure, scalable, and customizable. Tableau Pulse leverages the published data sources on the Tableau platform, taking advantage of existing data security features to ensure users only see data they are authorized to view. Further, Tableau Pulse separates the Metrics Layer into metric definitions and metrics.
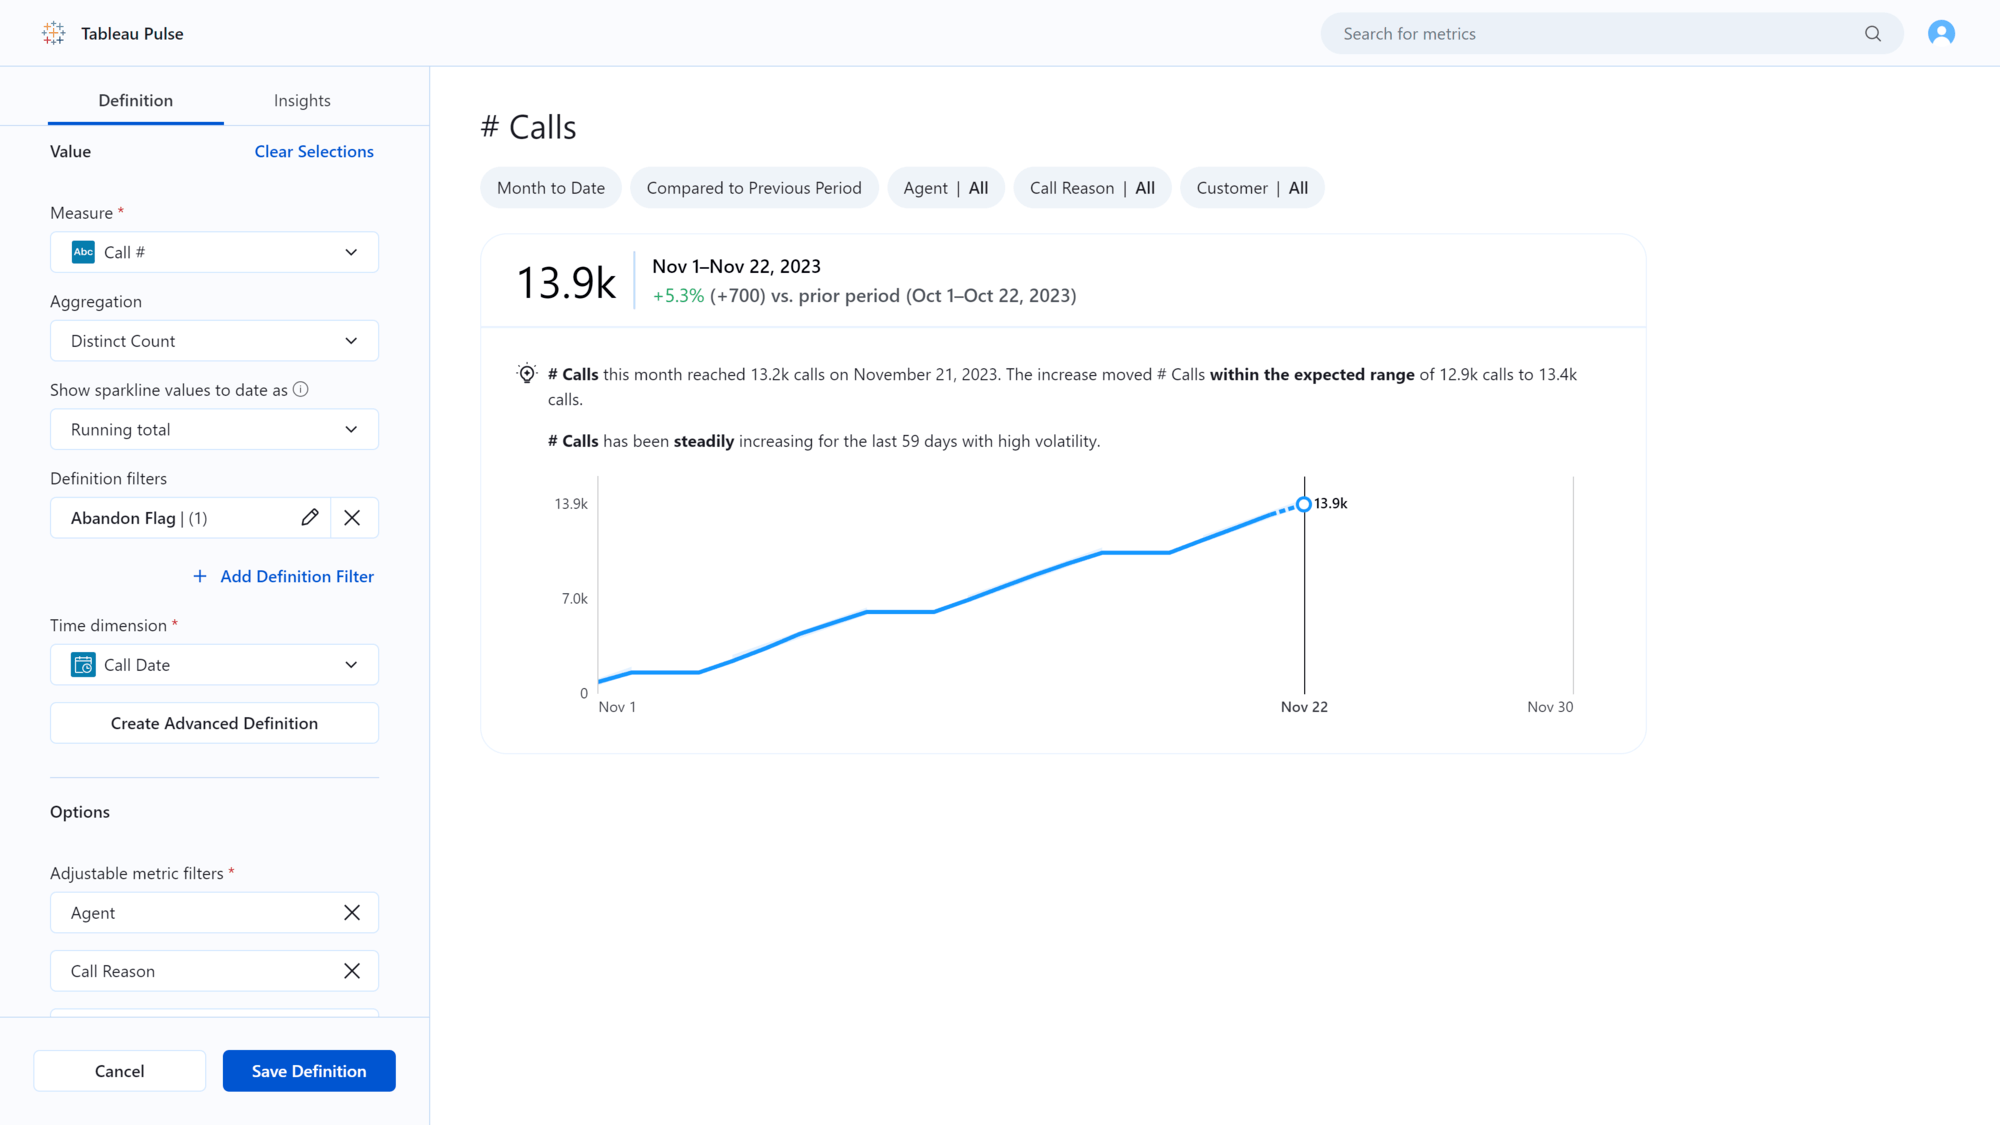
Metrics definitions are configured by data analysts in Tableau, and maintained in the site-wide Metrics Layer. They consist of a set of metadata that establishes the meaning and business context of the metric, including:
- Metric name
- Measure and aggregation, as well as calculations if the measure does not yet exist in the datasource
- Fixed definitional filters required for the metric to have meaning, e.g., Status = Open
- A time dimension used to orient on and provide time comparisons
- A set of related dimensions that allow business users to meaningfully break down the metric, as well as provide the Insight platform with focus points when generating Insights
- Additional metadata, such as whether an increase in the metric would be favorable or unfavorable
Tableau Pulse ensures that there is only one metric definition for a set of metadata on the system, providing a single source of truth.
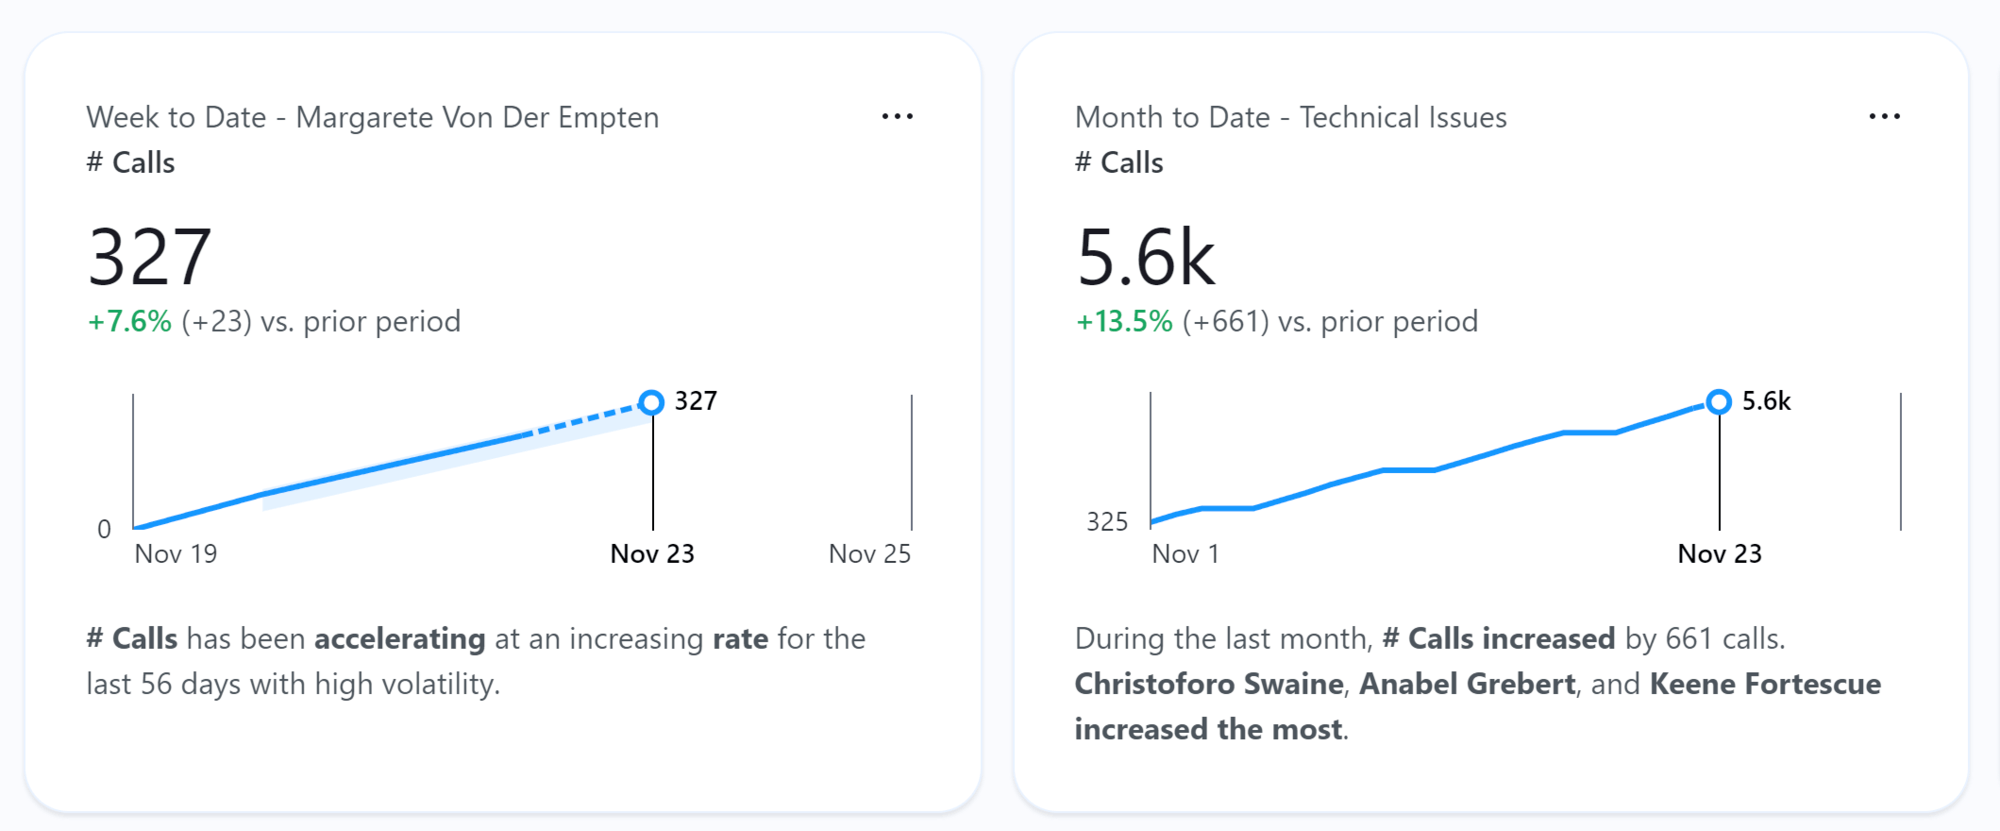
Metrics sit on top of a metric or KPI definition and include a time and filter context. Any user with access to the data source can select the time period and filter values from the related dimensions they are interested in and start following the metric. This means there can be many metrics on top of a metric definition, which makes them highly customizable.
The Tableau Pulse Metrics Layer is scalable—any changes that need to be made to the metric or KPI definition can be made once and will automatically apply to all Metrics related to that definition.
Considerations when creating metric layer and KPI definitions
The Metrics Layer should consist of your key metrics or KPIs that matter most to your users. Consider the creation of metric definitions for the information a business user would rely on a frequent basis.
Tableau Pulse Metrics rely on a time context, including time period filters such as month to date or week to date to ensure the metric is relevant within a comparison time frame. The time comparison allows context and Insights on how a Metric is trending. When creating a Metric definition, ensure that the datasource has a relevant time dimension.
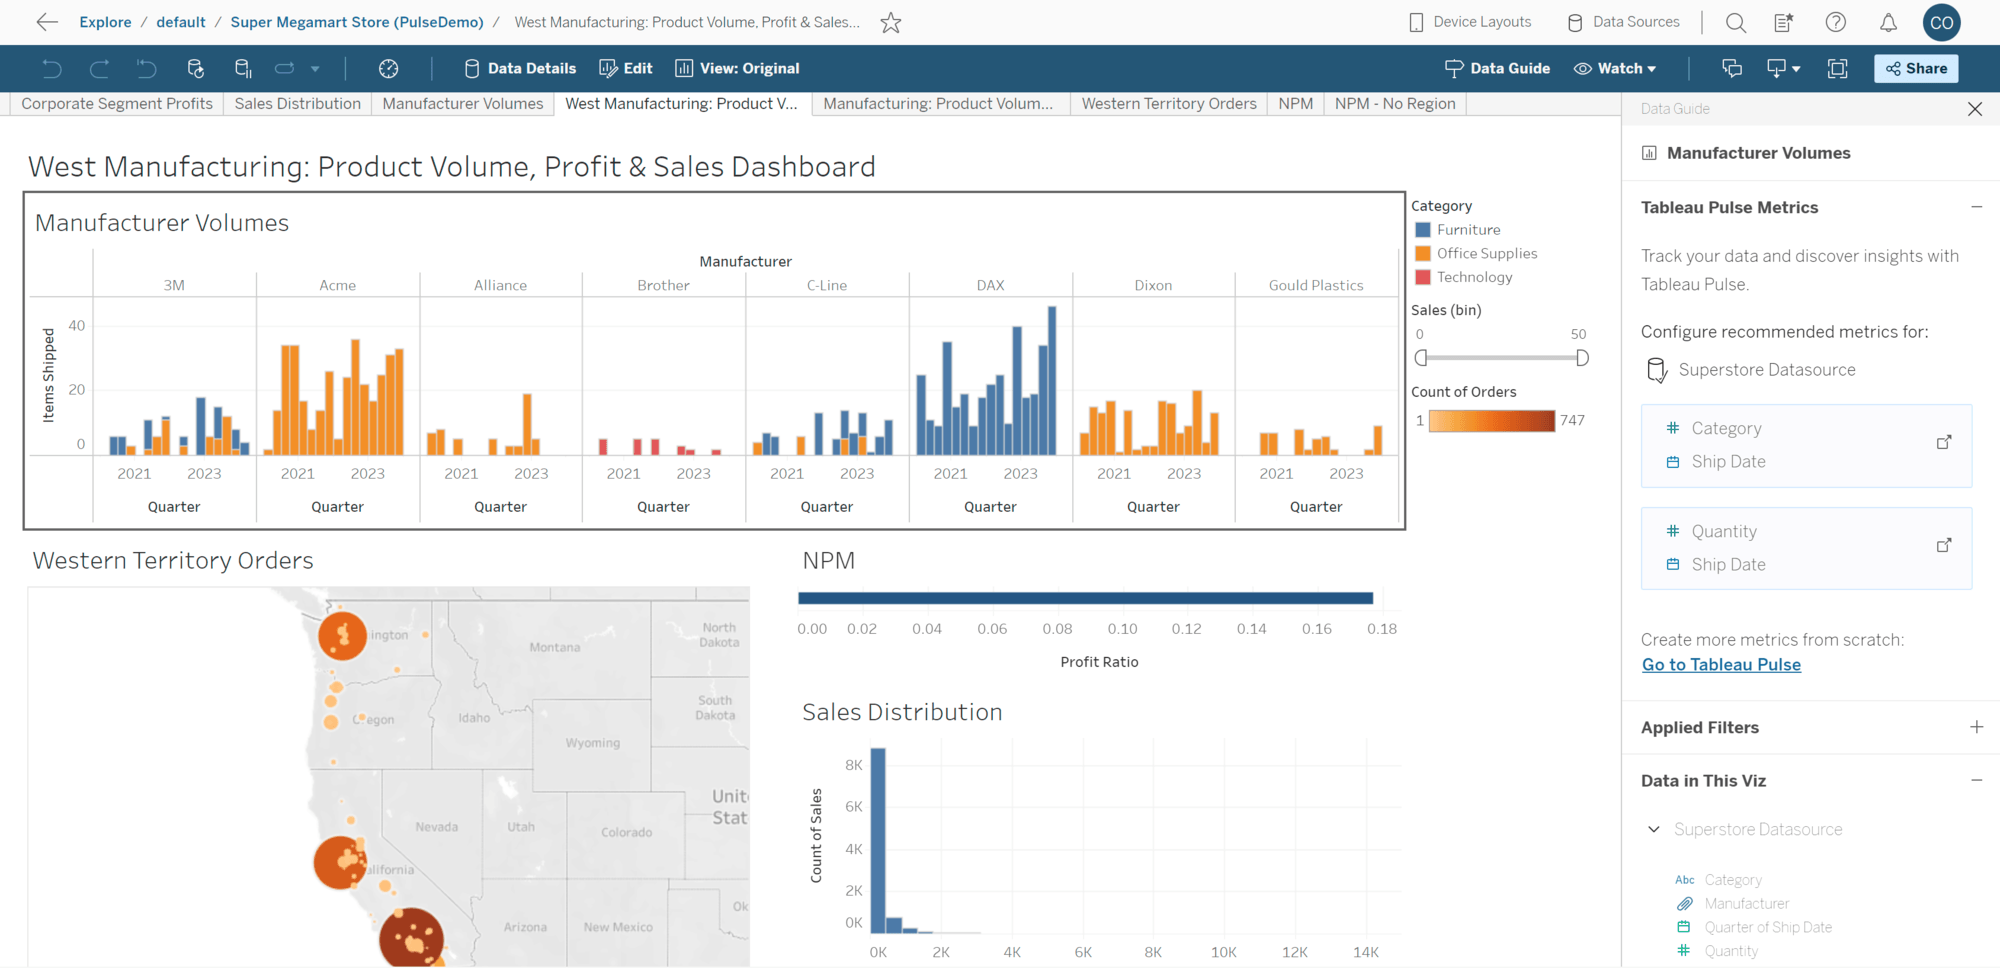
To leverage investments in existing Tableau dashboards, Tableau Pulse provides metric definition bootstrapping capabilities directly from the Data Guide.
How the Tableau Pulse Metric Layer helps analysts empower their organization
Through self-service analytics, interactive dashboards, and data-driven decision making, analysts have shown organizations the importance of data in improving business outcomes. However, today about 70% of business users still do not use data for decision making, even when analysts have provided them with dashboards.
These users are responsible for a favorable business outcome and would hugely benefit from tracking their KPIs. They would also like to demonstrate how they make data-driven decisions. However, they find it hard to discover and access data when it is locked in applications they rarely use. When they do manage to access the data, they often struggle to understand it. And even if they do understand the data, they may not be able to take action on it because they don’t know what to do. Lastly, they wonder if they can trust the data they are looking at, given all the different dashboard versions.
Tableau Pulse addresses these business user challenges by reimagining their data experience—built on the Tableau platform—to make it personalized, contextual, and smart.
Business users get a curated set of metrics and insights personalized to their work, so they can discover new opportunities, get ahead of issues, and make better decisions. To make accessing, sharing, and collaborating on data seamless, Tableau Pulse infuses data into their flow of work. Users get reliable and contextual information when and where they need it, so they can make timely, data-driven decisions. And with generative AI throughout the experience, Tableau Pulse can automatically detect and generate insights, summarize information, and enable on-demand exploration so organizations can deliver analytics at scale.
However, none of this is possible until analysts first populate the Metrics Layer. Because of the business semantics in the Metrics Layer, Tableau Pulse can answer the common questions business users ask of data and proactively surface answers in natural language to answer the “what, why, and so-what.”
With Tableau Pulse as their superpower, analysts can be the data hero who enables the next business user experience and brings data into every corner of the organization.
Watch the demo to see how the Metrics Layer in Tableau Pulse powered by Tableau AI comes to life.
Related Stories
How Tableau’s CRO Uses Tableau Pulse
 March 11, 2024
Now Available in 2024.1 Release: Tableau Pulse, Metrics Layer, Viz Navigation, and More
 February 22, 2024

Tableau Metrics and Natural Language Query Evolve with Tableau Pulse
 February 21, 2024
Subscribe to our blog
Get the latest Tableau updates in your inbox.