
Tableau 2019.2 Features
Explore the newest features in Tableau 2019.2 including parameter actions, vector maps, and a new Tableau Server browsing experience
Feature highlights
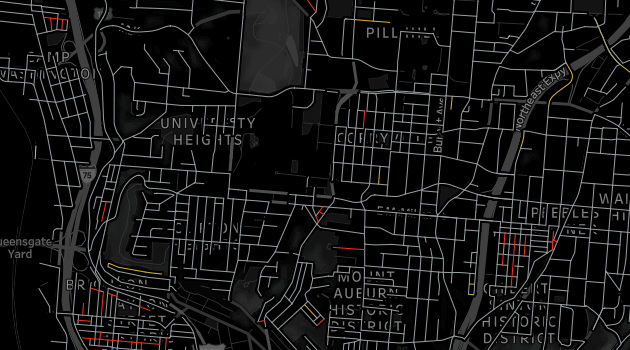
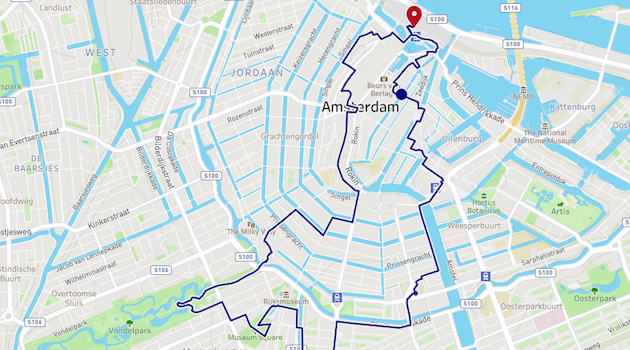
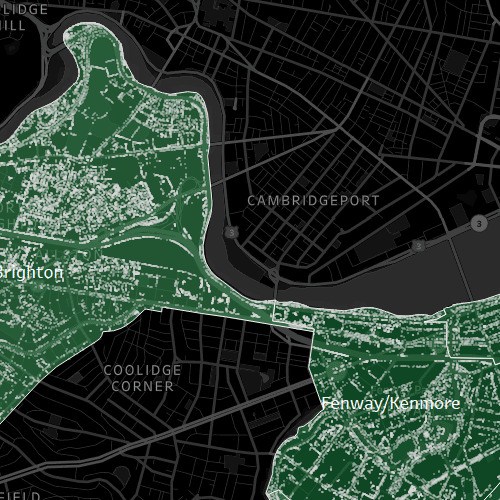
Vector maps
Enjoy a richer mapping experience with vector-based maps. Maps will look even sharper and feel even smoother, as you pan, zoom in, and zoom out to explore your geospatial data. Enjoy updated dark, normal, and light default styles, ACS demographic data, and for authors, new map styles and layers available right out of the box.
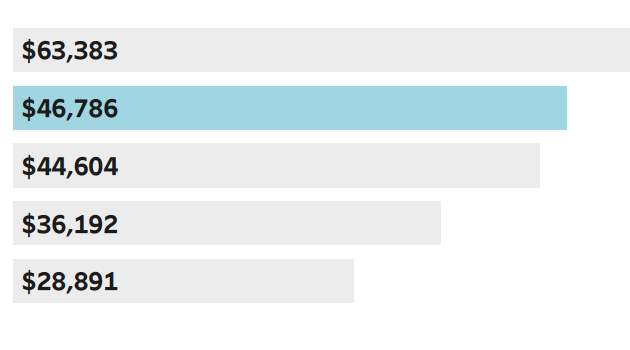
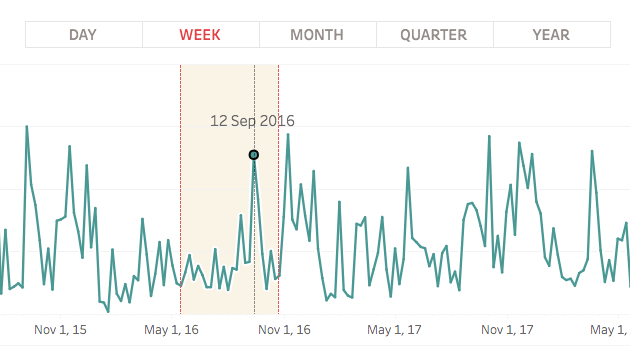
Parameter actions
You now have the ability to visually change a parameter’s value. Use parameter actions to drive reference lines, calculations, filters, and SQL queries simply by interacting with marks on a viz, bringing visual interactivity to your data like never before.
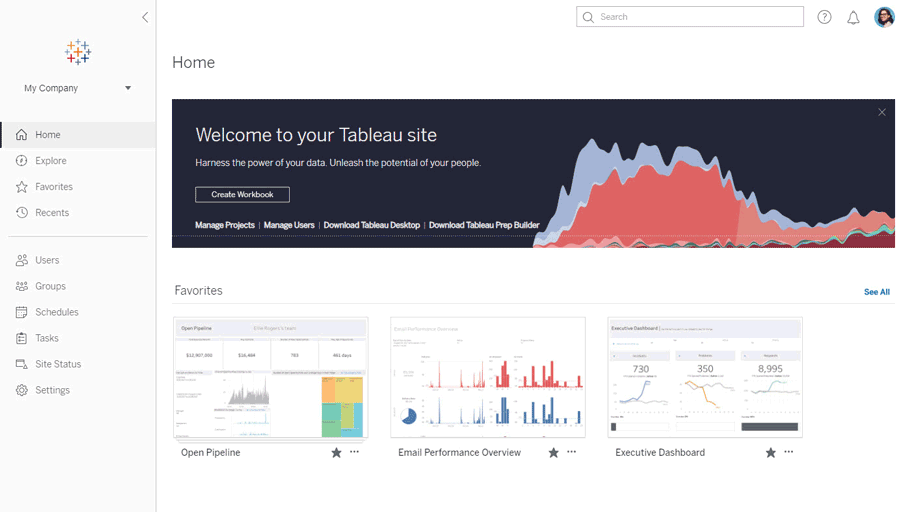
New Tableau Content Browsing Experience
Arrive to a new home page on Tableau Server and Online that displays personally relevant content upfront. A new left navigation makes it easy to quickly access favorites and recents, and discover new content through popular views. Additionally, a welcome screen will walk new users through specific actions based on their role.


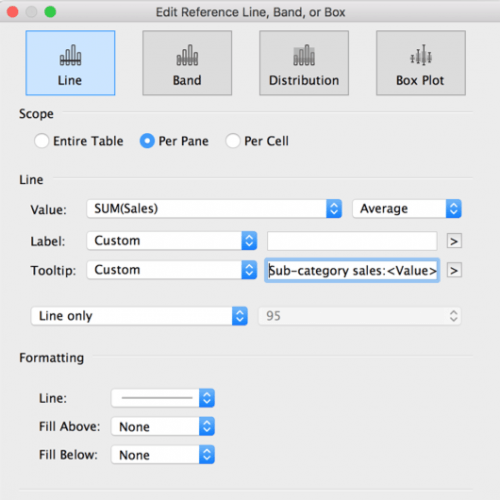

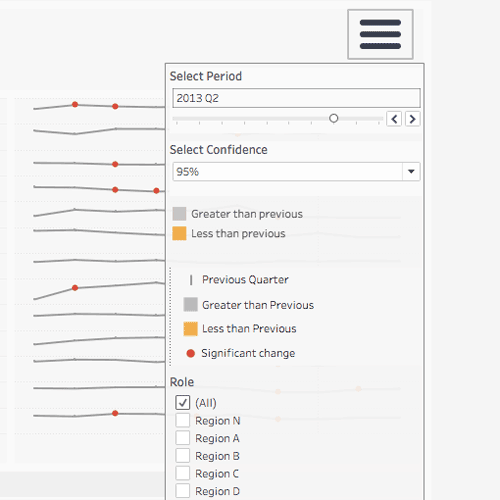
Customizable reference line tooltips
You now have the option to customize tooltips for reference lines, bands, and distributions. Edit the tooltip text, or choose to disable the tooltip altogether.
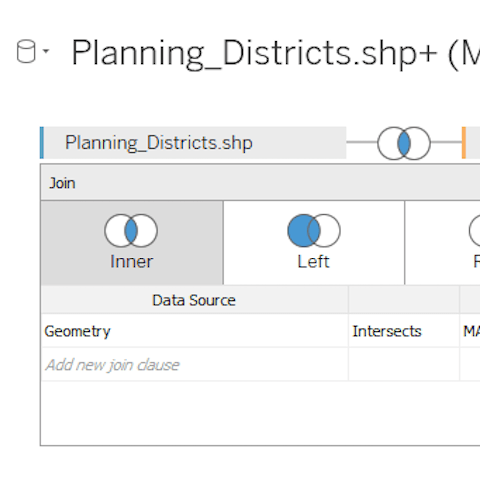

Spatial calculations: MakePoint
You can now turn latitude/longitude values from text files, excel, or any data source into spatial fields and use them in spatial joins. With MakePoint, you can spatially enable text files and excel spreadsheets, making it easer to spatially aggregate your data.
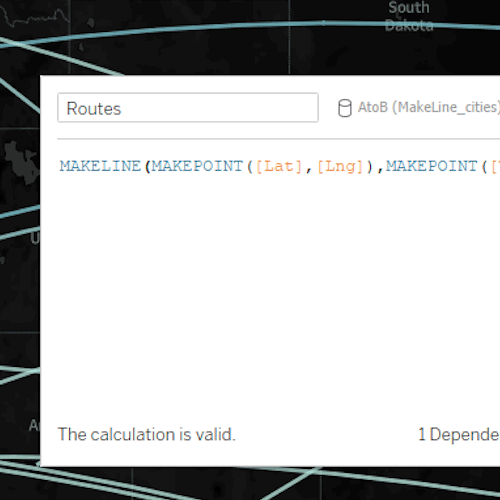

Spatial calculations: MakeLine
You can now easily create two-point origin-destination maps, perfect for making flight maps of airline routes.

Parameter actions
You now have the ability to visually change a parameter’s value. Use parameter actions to drive reference lines, calculations, filters, and SQL queries simply by interacting with marks on a viz, bringing visual interactivity to your data like never before.

PostgreSQL+PostGIS Spatial support
You will now be able to use spatial data directly from a PostgreSQL or Pivotal Greenplum database with the PostGIS extension. No need to export or pre-process the data before diving into it in Tableau. And perform more advanced spatial analysis with the ability to now leverage the spatial operations supported by the database.

Show/hide dashboard containers
Maximize screen real estate with the flexibility to toggle between visible or hidden for any floating container on your dashboard. Streamline what content viewers see, such as customizing instructions, filters, or legends to be hidden when they are no longer useful.
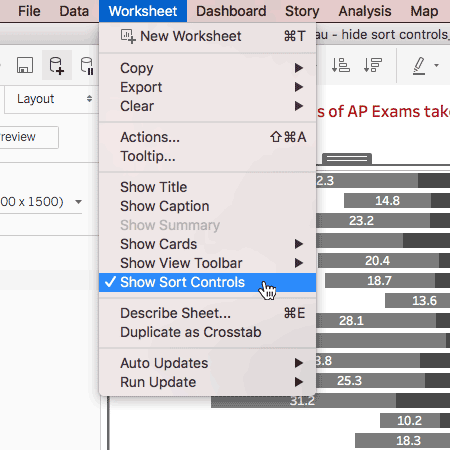
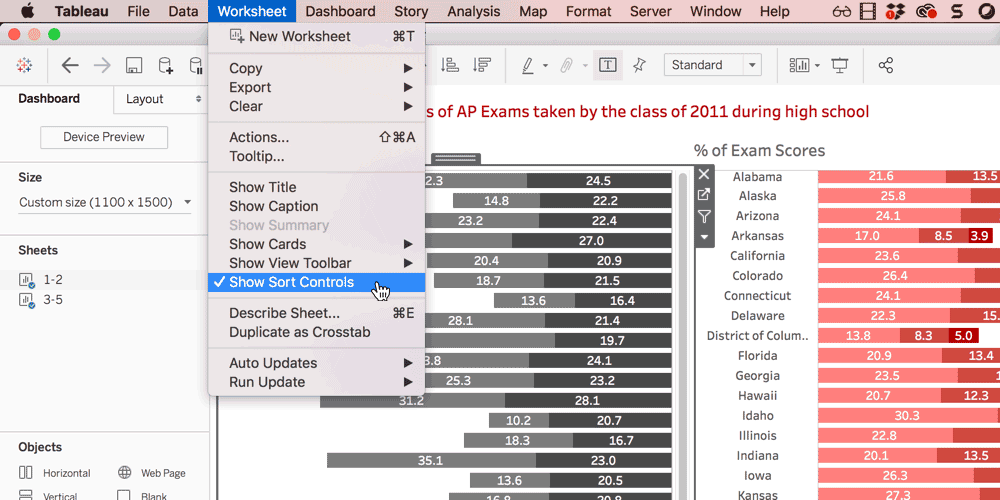
Show/hide sort controls
Authors can now preserve the sort order they’ve set on their worksheet by disabling the ability to one-click sort. Rest assured that end-users are always interacting with your data as you intended, for the best dashboard experience.
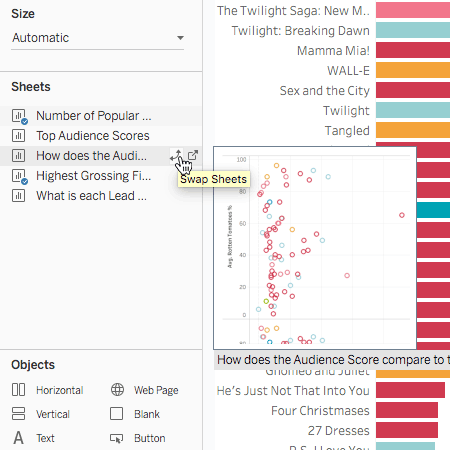
Replace worksheet in a dashboard
You can now replace an existing worksheet in a dashboard with a new worksheet from the sheet list, with a single click. Dashboard spacing, dimensions, and aspect ratios are all smartly preserved, for a faster and more precise authoring experience.
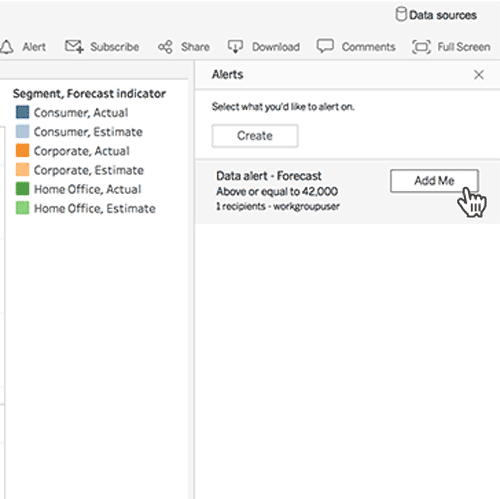
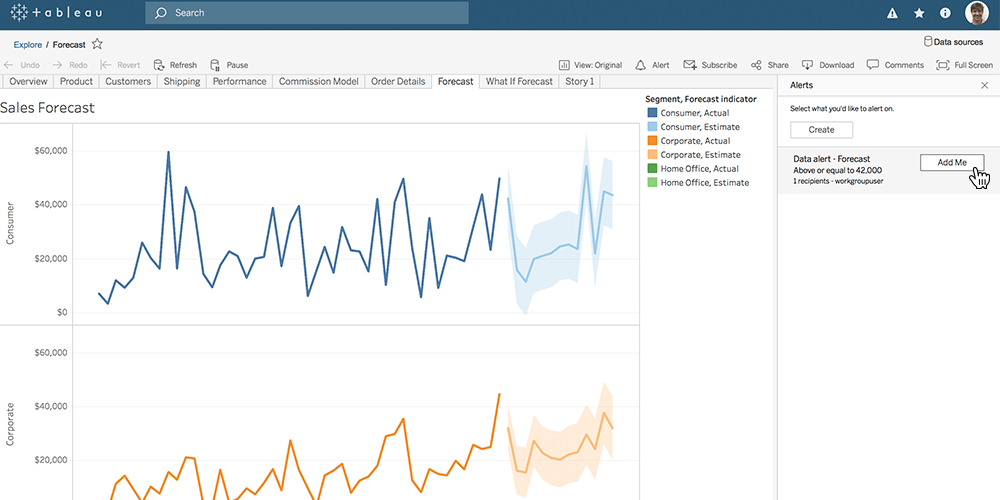
New data-driven alerts view
Subscribe yourself to existing data-driven alerts. A new view shows all alerts that already exist for the viz you are viewing. Adding yourself or others is easy—just select “Add Me.”
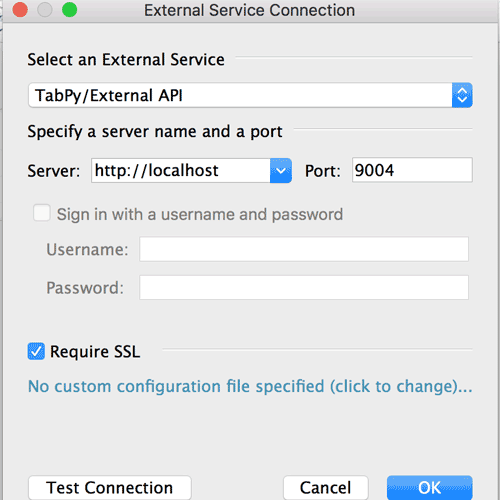
Secure TabPy connections
Build visualizations using the Python language for advanced analytics and machine learning in a secure environment. This allows TabPy to be hosted remotely from Tableau Server, and for data to be protected in transit.
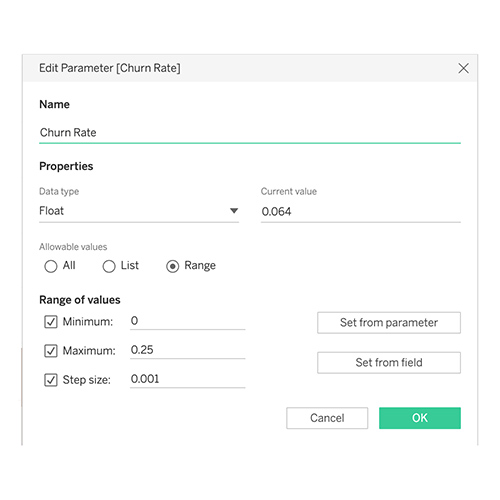
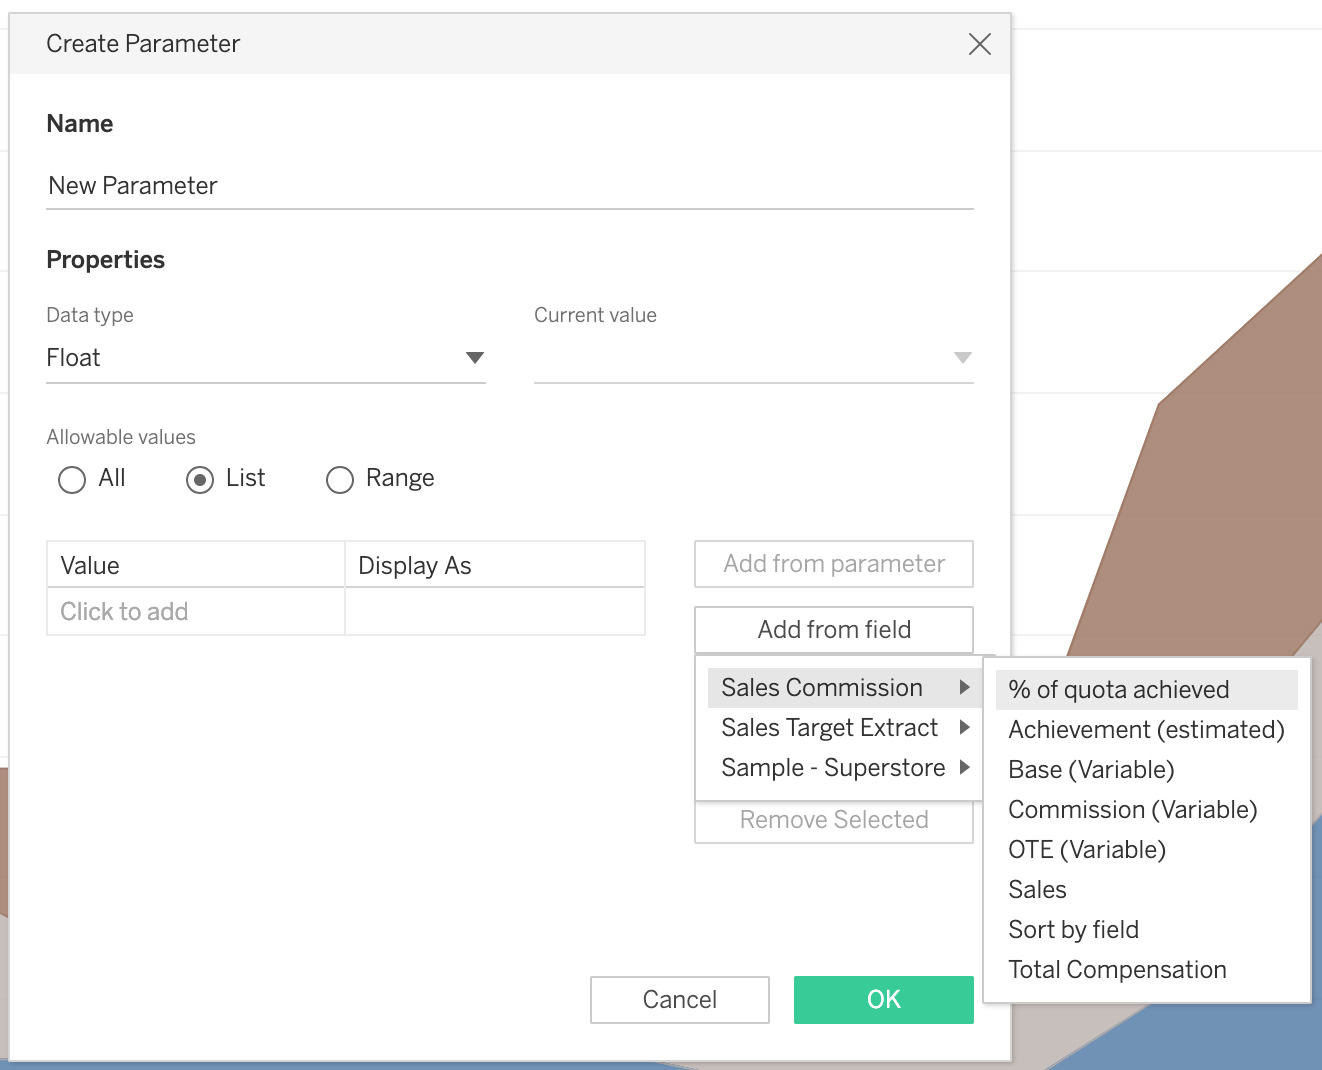
Create and edit parameters in the browser
Now you can create and edit parameters, which are dynamic values for calcs, filters and reference lines in the browser and stay in the flow of your analysis.
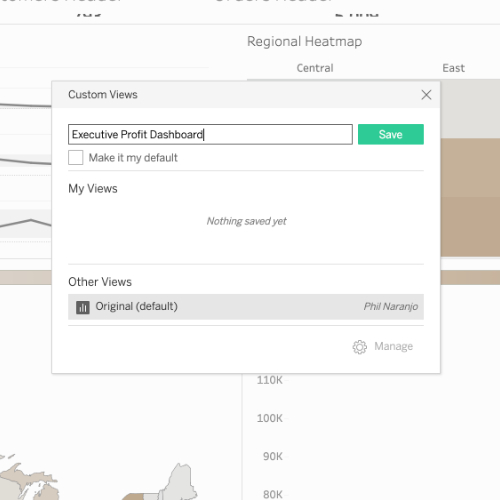
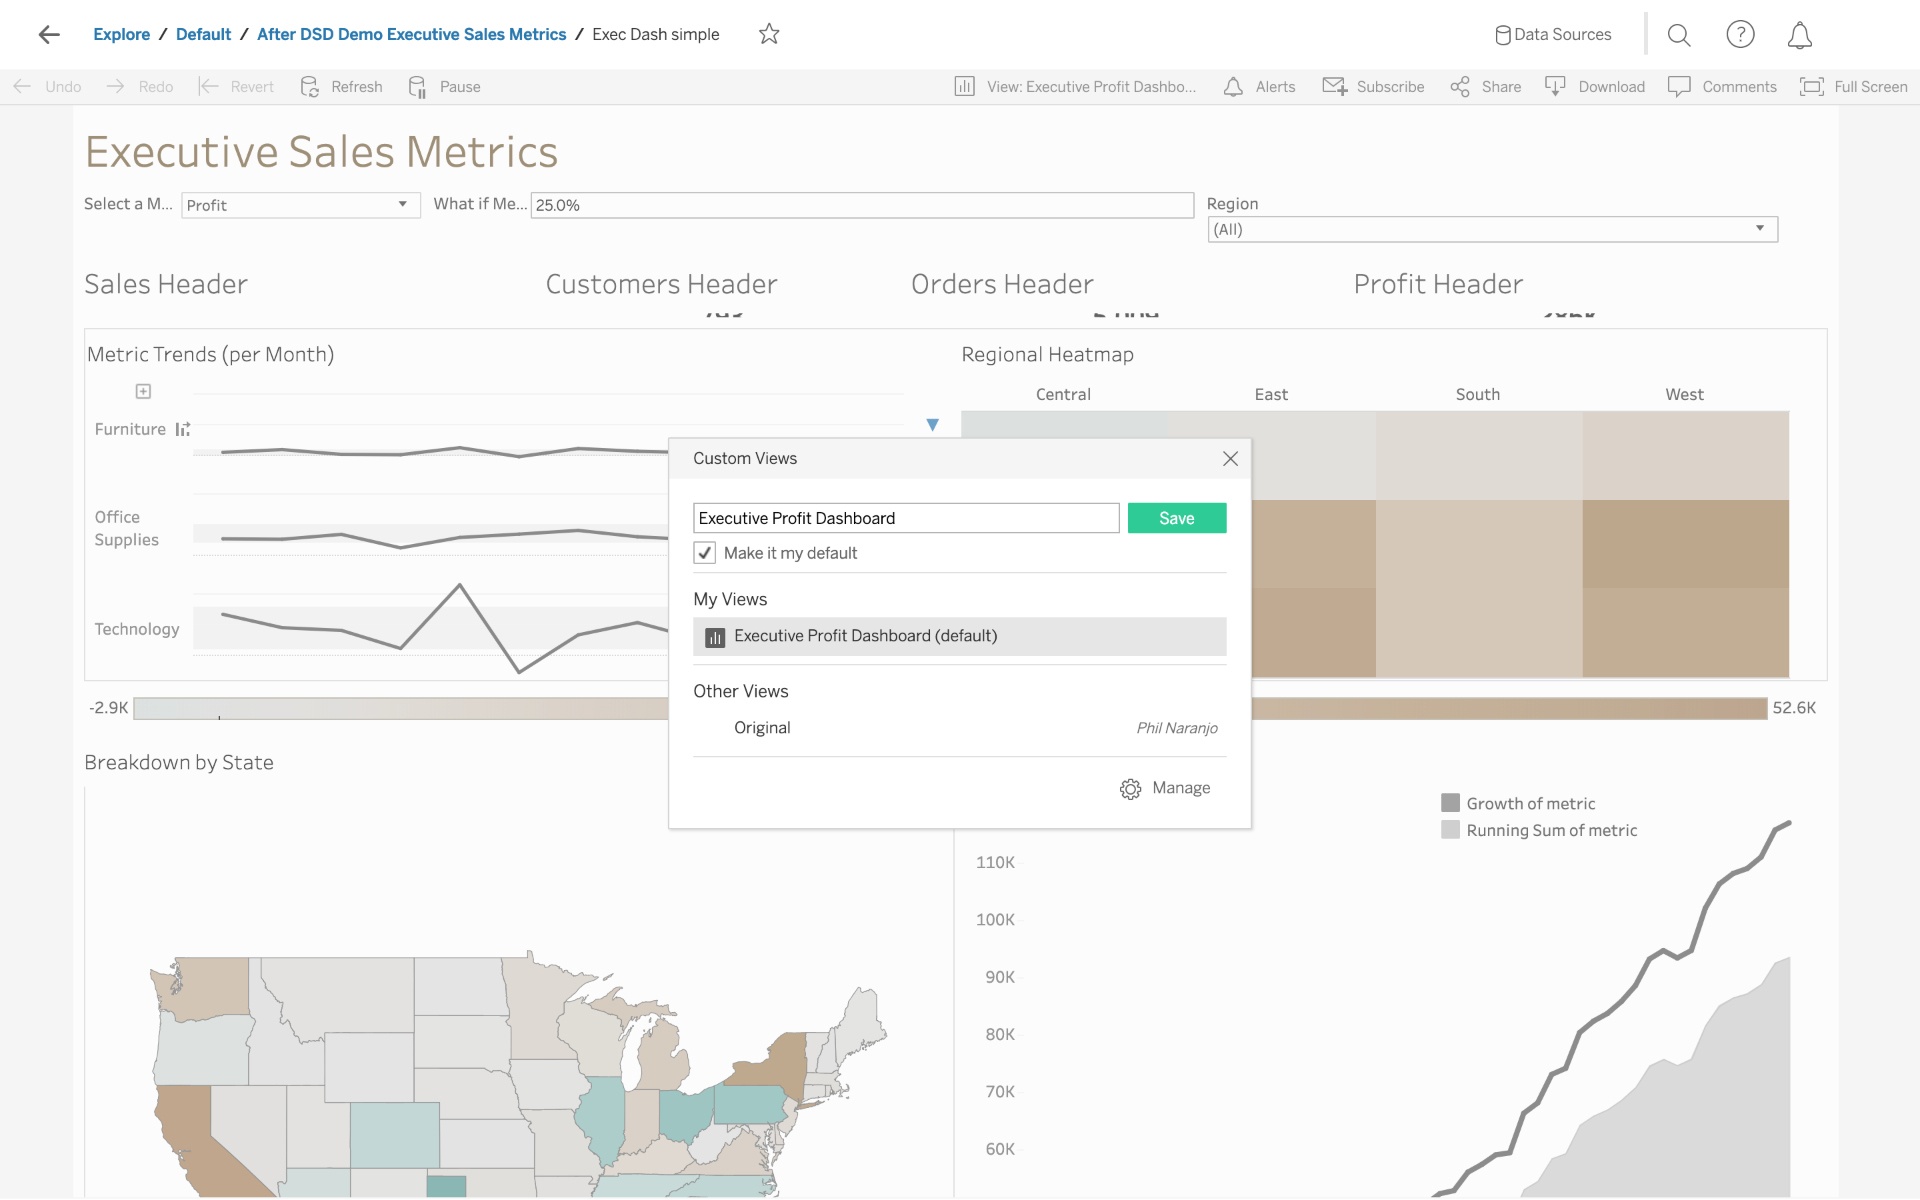
Create and save private custom views as a Viewer
As a Viewer, you can save private, custom views in dashboards you care about, filtered to the information you want to see. Jump back in and get the information you need, quickly and easily every time.
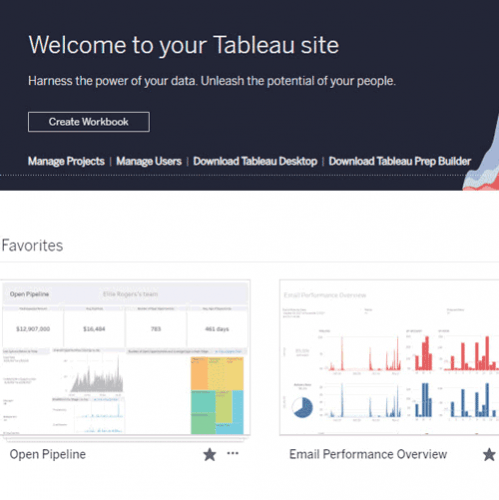

New Tableau Content Browsing Experience
Arrive to a new home page on Tableau Server and Online that displays personally relevant content upfront. A new left navigation makes it easy to quickly access favorites and recents, and discover new content through popular views. Additionally, a welcome screen will walk new users through specific actions based on their role.
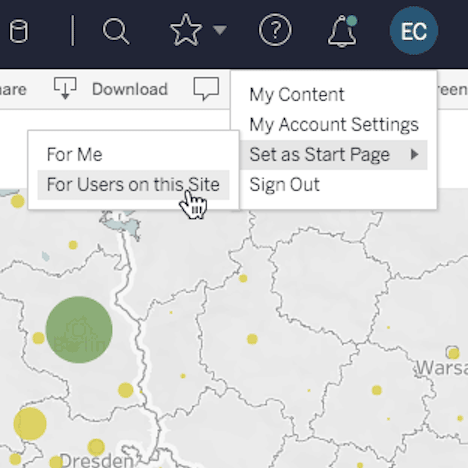
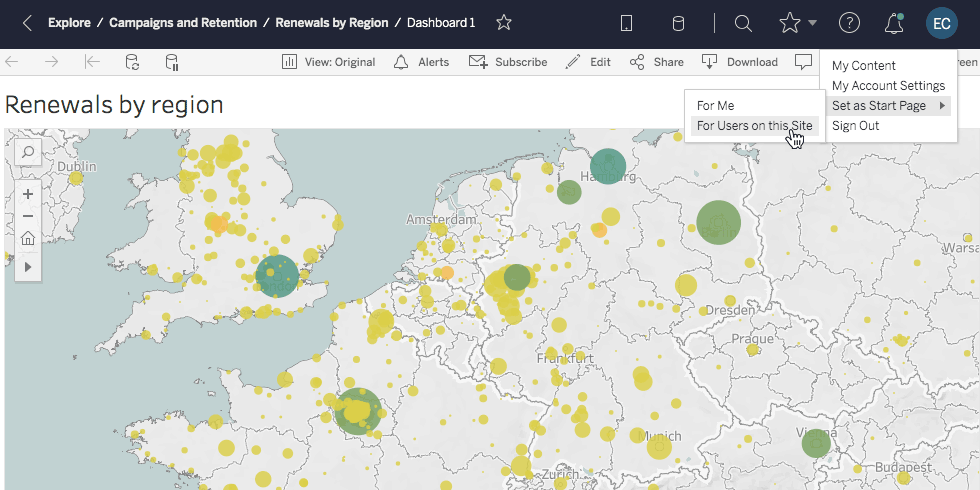
Site start page
Tableau Server and Tableau Online site admins can now set a start page for the entire site, controlling where all users land when signing-in.
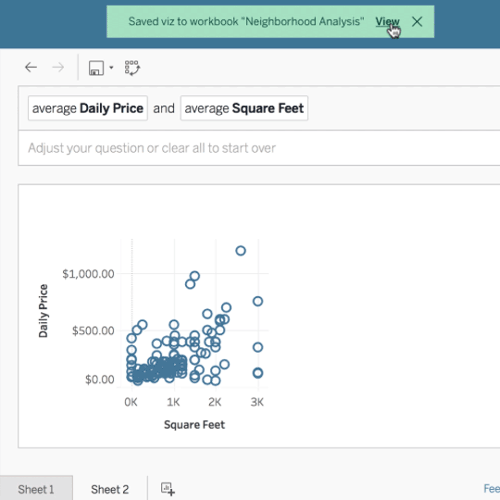
Ask Data improvements
We're making Ask Data feel even more conversational. Now you can add, remove, or replace statements with follow-up phrases. Adding calculations, such as the sum, difference, and the ratio of two measures is as simple as typing "avg sales / avg profit". Plus with the ability to create multiple sheets, you can build full dashboards from Ask Data generated vizzes. All of these enhancements make it easier to get answers from your data.
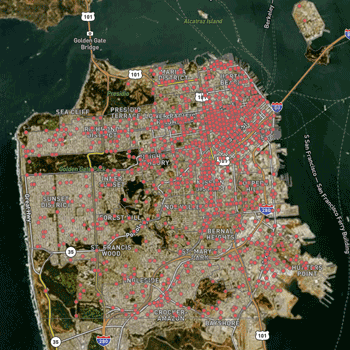
Vector maps
Enjoy a richer mapping experience with vector-based maps. Maps will look even sharper and feel even smoother, as you pan, zoom in, and zoom out to explore your geospatial data. Enjoy updated dark, normal, and light default styles, ACS demographic data, and for authors, new map styles and layers available right out of the box.
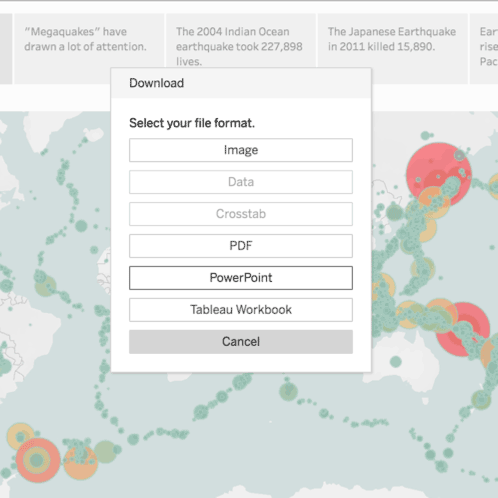
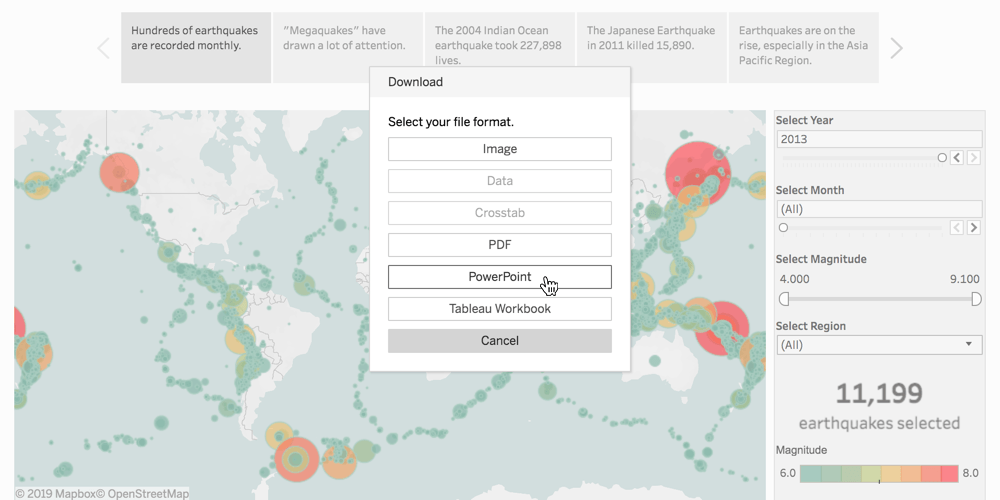
Export to PowerPoint improvements
You can now export stories to PowerPoint, creating a presentation-ready deck in seconds. Each story point, as you have customized in Tableau, will appear as one slide.
JDBC
SAP Hana
ServiceNow ITSM
Marketo
You can now access more tables with our improved connector.
Microsoft Azure SQL Data Warehouse
We now support Azure Active Directory username and password authentication.
Admin views for flow resource governance
See and understand your flow resourcing needs with admin views of flow runs. Know when you need to put more resources toward concurrently running flows.
JDBC
Enjoy better memory utilization, faster initial connections, and improved query performance with our JDBC connector enhancements.
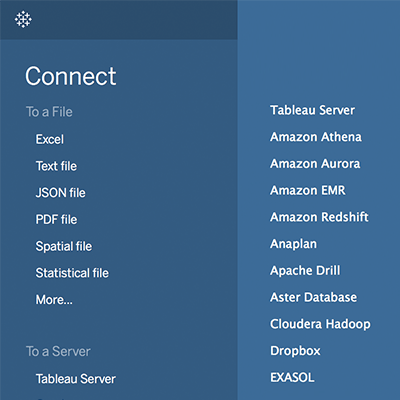
Athena
You can now connect to your data in Amazon S3 with the new Athena connector.
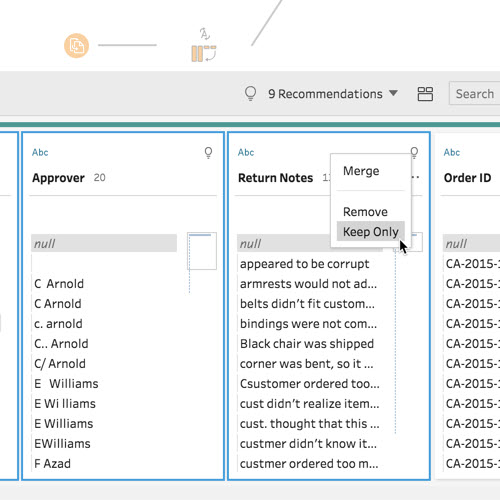
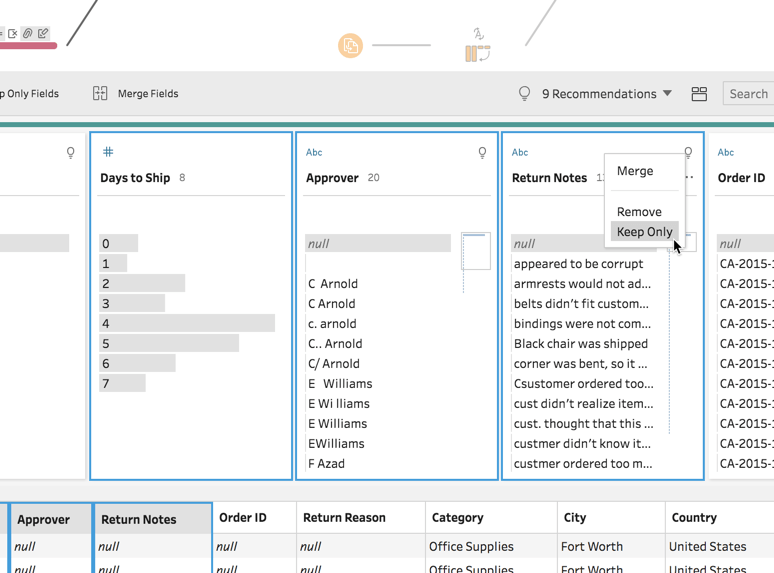
Keep Only columns
Quickly start prepping the data you need, and remove the data you don't with just a few clicks. "Keep Only" the columns you want.
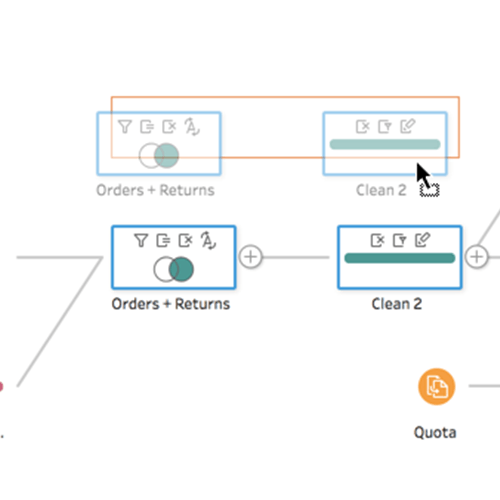
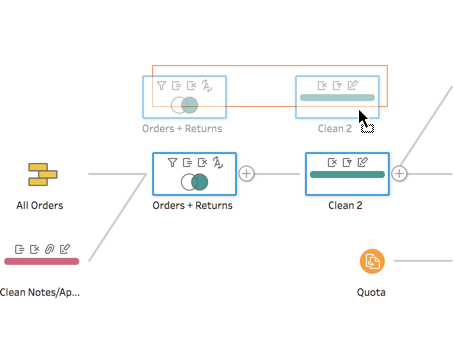
Rearrange steps in flow
Keeping your flow in a step by step process that makes sense to you, makes it easier for you to find just what you're looking for. With this feature, you'll be able to rearrange the steps on the flow canvas so it stays in line with the way you think.
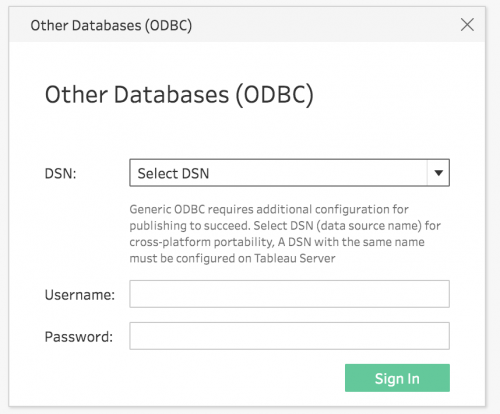
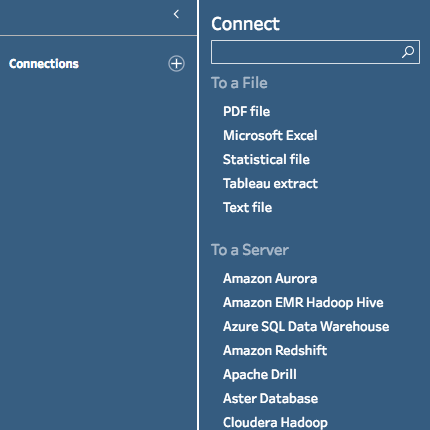
ODBC Connection
Connect to databases or files that don't have direct connections to Tableau Prep using an ODBC (Open Database Connectivity) connector.
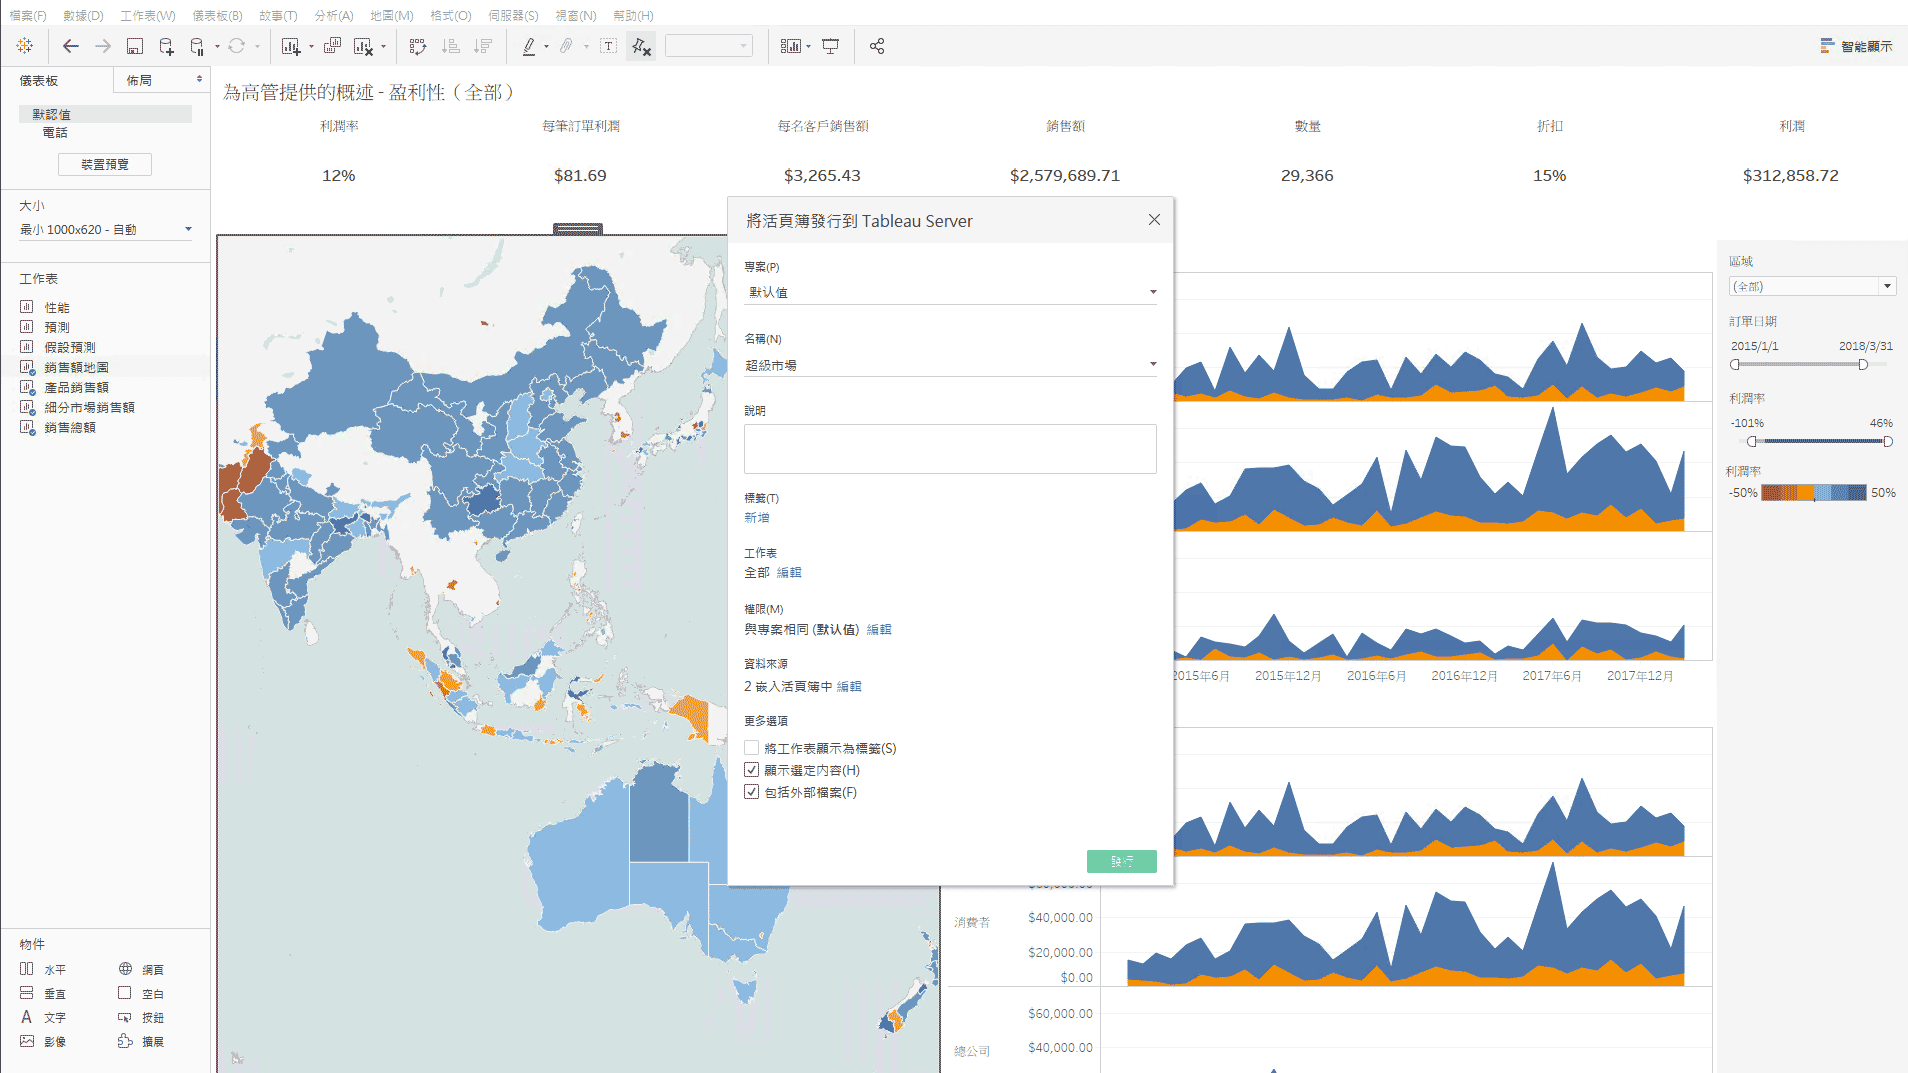
New product languages
See and understand data in your local language. All Tableau products are now available in localized versions for Traditional Chinese and English (UK).