Viz with the DataFam to Sharpen Your Data Skills


In the Beginner’s Guide to Tableau Public, we reviewed the value of creating a free Tableau Public profile page alongside step-by-step instructions. Then, we explored how to analyze data, starter data sets and projects, and related resources in Getting Ready to Publish Your First Data Visualization. Next in this series, we delve into Tableau Community Projects, exploring vizzes on Tableau Public, and more ways to connect with the DataFam.
Jumpstart Learning with a Community Project
Tableau Community Projects are skill-based challenges designed and led by community members to help you learn, practice, and apply data skills across various topics, products, and causes. Everyone is invited to participate in these projects—at all skill levels.
Not sure where to get started? We get it. The options can be overwhelming. Here are a few recommendations based on your level of experience.
Community Projects for Beginners
Back 2 Viz Basics is a project geared towards those who are newer in the community or looking to practice Tableau and build foundational data viz skills. If you’d like to explore what others have created, search the project hashtag, #B2VB, on Public. Project frequency? Every other week.
![]()
Back 2 Viz Basics Submission Tracker on Tableau Public by Eric Balash
Makeover Monday explores different perspectives and approaches to create more effective data visualizations. If you’d like to explore what others have created, search the project hashtag, #MakeoverMonday, on Public. Project frequency? Every week.
Community Projects for Intermediate Users
The Iron Quest challenge helps you practice your data sourcing, preparation, and visualization, and storytelling skills. Pro tip: Because it intentionally follows a similar format to the Iron Viz qualifier contest, it’s a great way to get ready for the next Iron Viz competition. If you’d like to explore what others have created, search the project hashtag, #IronQuest, on Public. Project frequency? Every month.
![]()
Iron Quest Tracker on Tableau Public by Sarah Barlett
The Real World Fake Datachallenge provides data sets and starter dashboards (via Tableau Accelerators) for the Community to create and redesign business dashboards. If you’d like to explore what others have created, search the project hashtag, #RWFD, on Public. Project frequency? Every quarter.
The above projects are only a few of the various community projects waiting for your participation. Check out the complete list of community-led projects for even more options on a wide variety of topics and interests including doing good with data, healthcare-specific analysis, and so much more.
Looking for more viz-piration?
On the Tableau Public homepage, you’ll find a number of different channels to explore based on trending content, authors you follow, and topics of interest.
To explore all of the vizzes in a specific collection, click See All in the upper right-hand corner of a collection.
Below, we take a closer look at each of these channels in more detail.
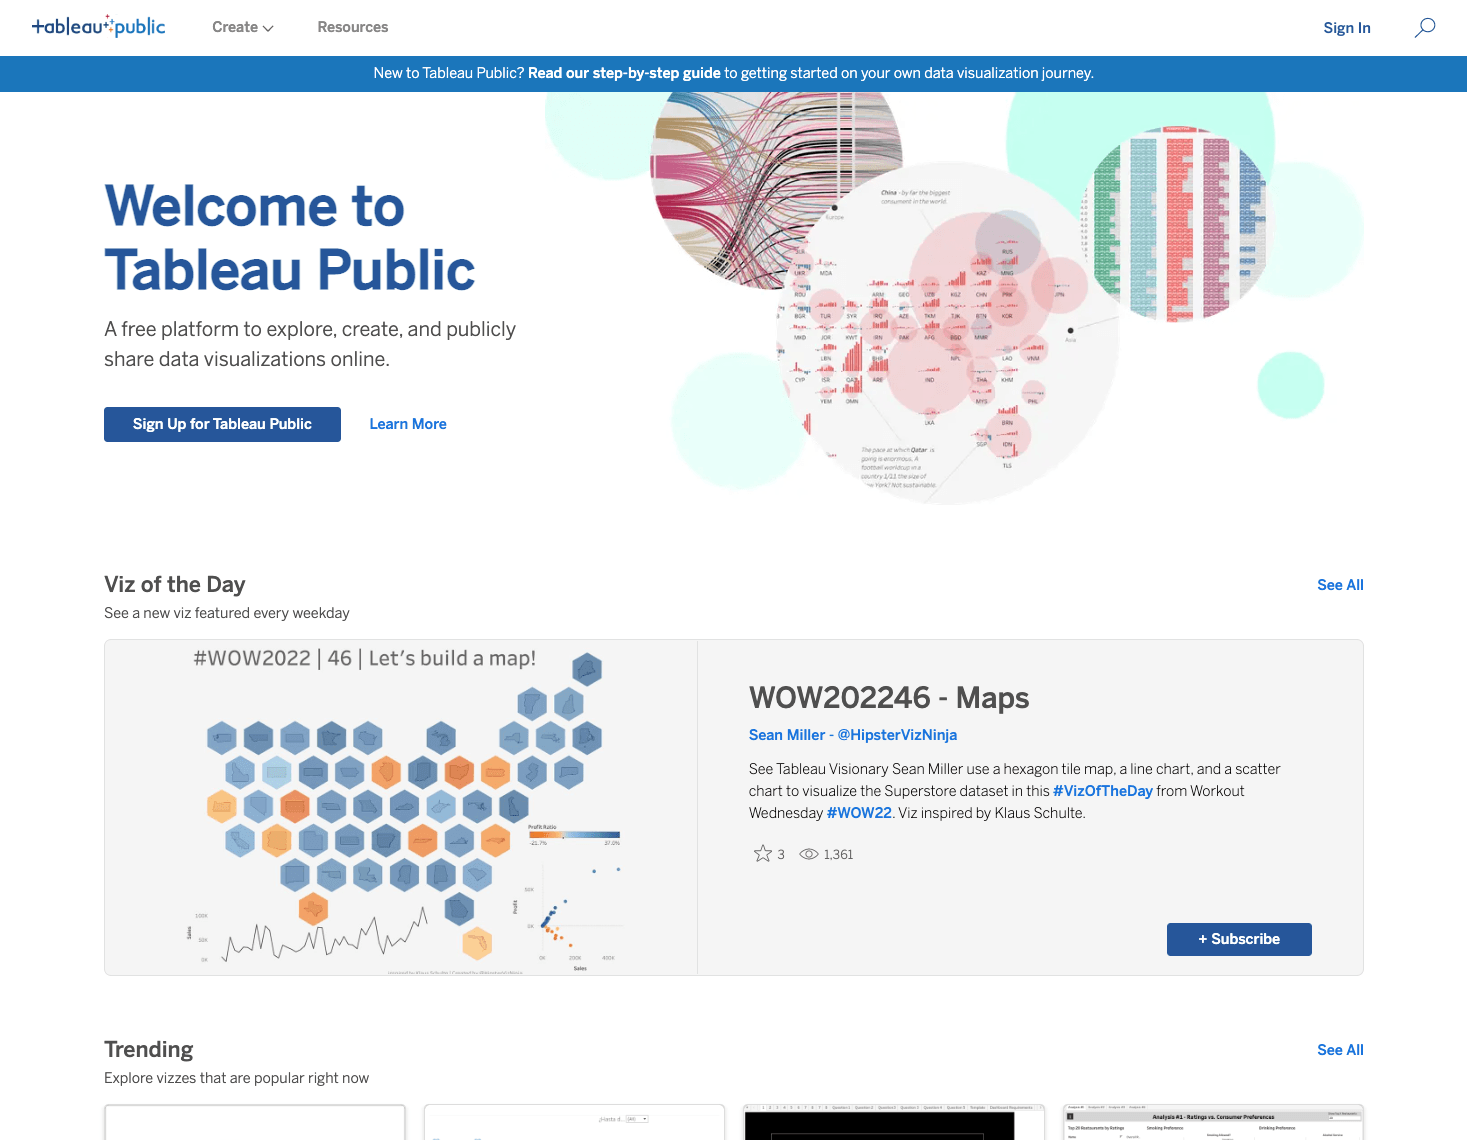
Viz of the Day
If you’ve already subscribed to Viz of the Day, you’ve been receiving amazing data vizzes directly to your email inbox. Additionally, you can always see the Viz of the Day near the top of the homepage. Pro tip: Find a viz you’d like to nominate for Viz of the Day? Click on the viz and select the Nominate a Viz icon.
Trending
Each day, Trending features 20 popular vizzes on Tableau Public. These span across a variety of different topics and languages.
Recent Activity
Did you know there's a custom channel just for you? But you can only view it if you're logged in. Recent Activity serves you personalized content based on the authors you follow. Want to discover more? Follow more authors! It’s that simple.
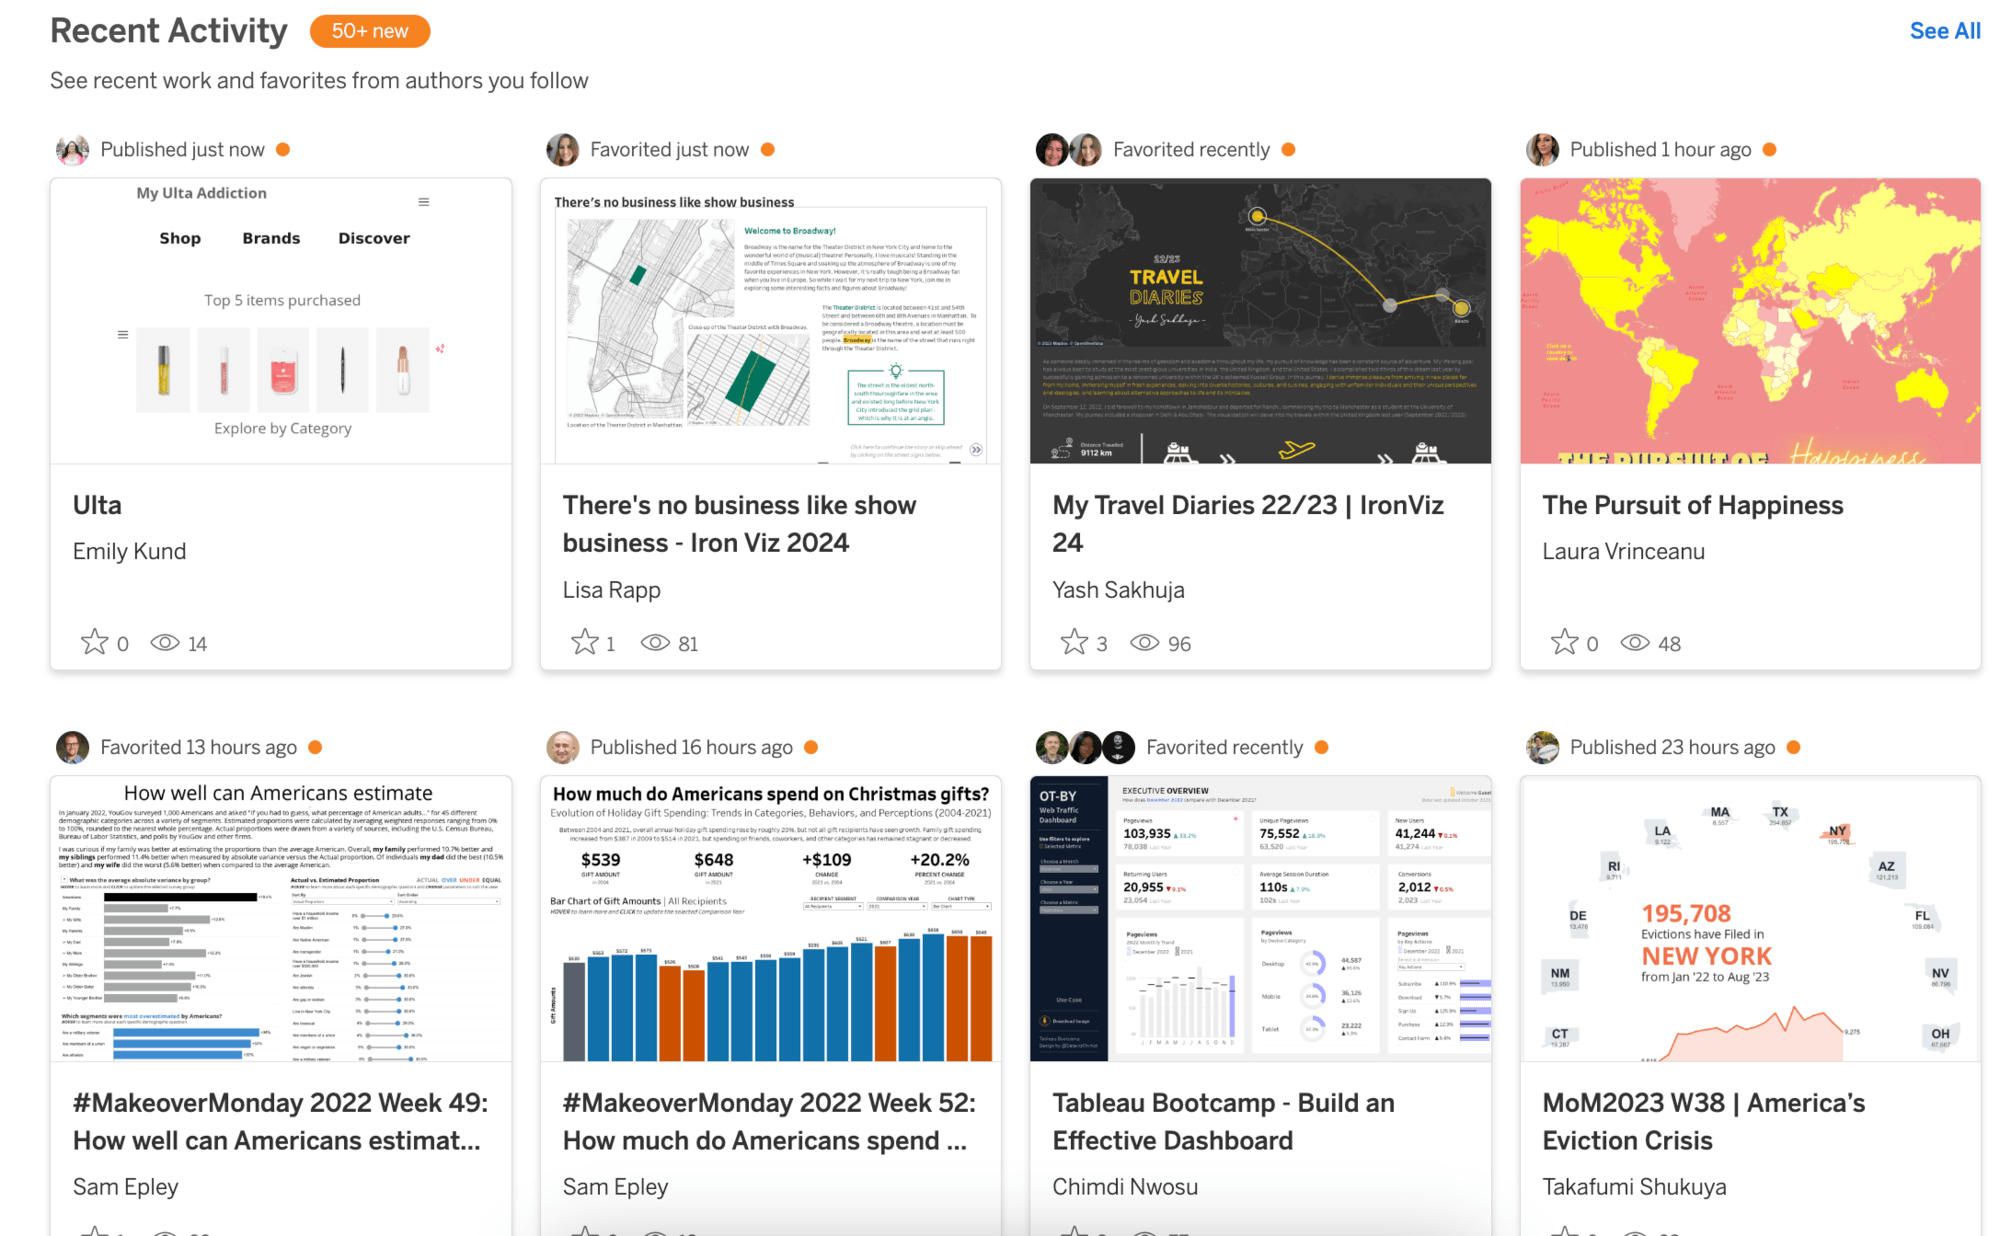
Log in to Tableau Public to view this custom channel. Each time you log in, notifications will display for the most recently published or favorited vizzes by authors in your network.
Featured Authors
Each quarter, we showcase our latest cohort of talented and inspiring Tableau Public Featured Authors. Explore their profiles, see who they follow, what they've created and favorited, and follow them to grow your own network. Pro tip: Look for an author's listed social media accounts on their profile for even more opportunities to connect!
Channels by Topic
There are 15 different channels dedicated to topics of interest including Learning Tableau, Maps, Business Dashboards, Time Series Analysis, and so many more. Take a few minutes to browse the homepage and explore them all.
Leverage the Power of Search and Hashtags
You can find the search tool at the top right corner of all Tableau Public pages. With search, you can explore your favorite topic, author, or even a specific chart type. The possibilities are as limitless as your imagination.
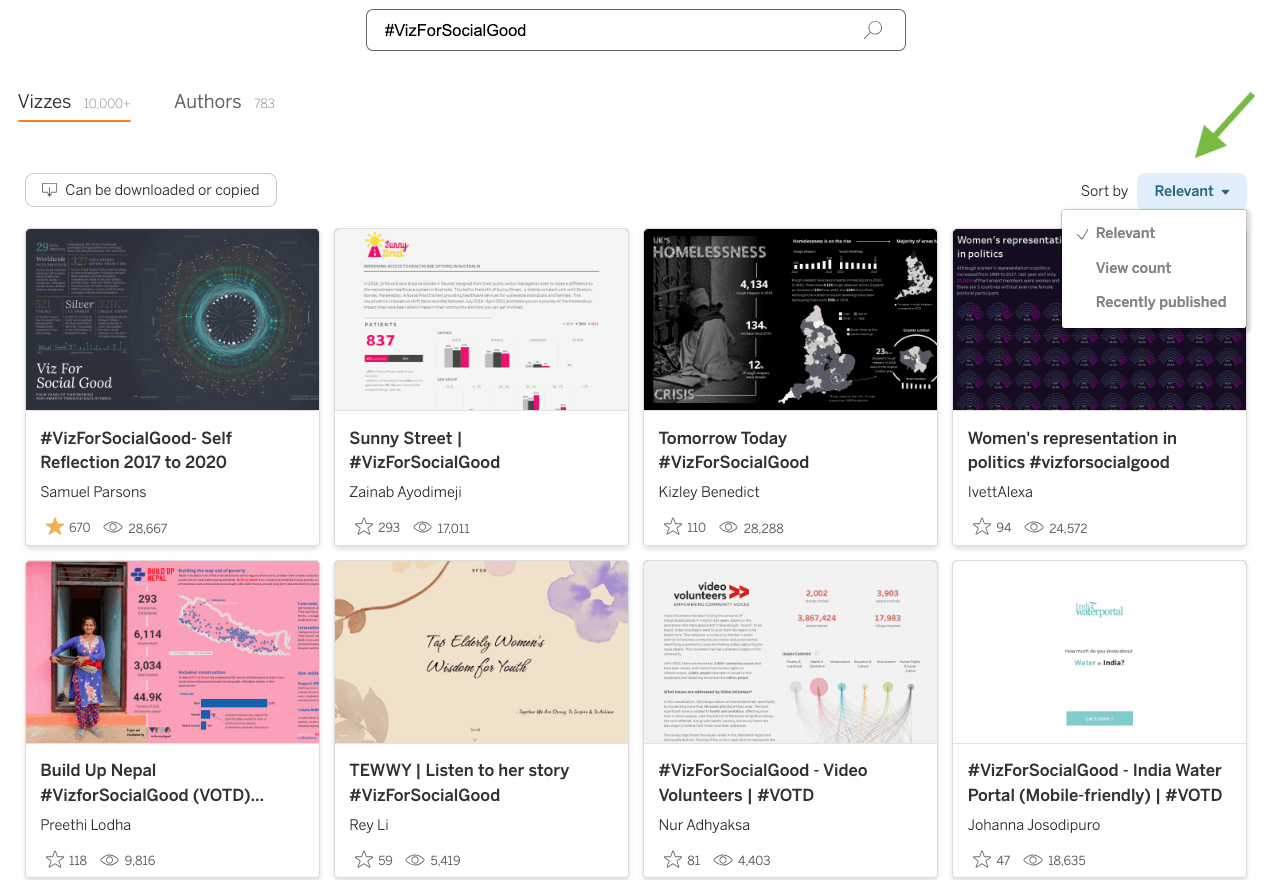
Note: Search results are displayed in two categories: Vizzes and Authors.
Vizzes can be displayed be relevance, follower count, or recently published. You can also identify vizzes that can be downloaded or copied by using the filter in the search panel.
Looking for a specific author? You can sort authors by relevance, follower count, or recently active and filter them by "available for hire".
Another helpful thing to search for are hashtags, and we have a whole list of them to get your started. Every Tableau Community Project has a hashtag and you can see them all here.
Not sure what a hashtag means? Check out this Twitter thread which defines 30+ hashtags.
Pro tip: As you’re exploring keep in mind that search on Tableau Public is case sensitive so #SportsVizSunday and #sportsvizsunday will provide you with different results. For accessibility, we recommend capitalizing the first letter of each word in a hashtag whenever possible.
As you're building your own vizzes and publishing them to Tableau Public, help others find and understand them by adding a concise title, description, and appropriate hashtags in the description field.
Looking for something specific that you haven’t been able to find directly on Tableau Public’s website?
Consider posting your inquiry on Twitter and including #DataFam. Example: I’m looking for a great example of a customer service dashboard for a call center. Any ideas #DataFam? It’s a quick way to get connected to the broader Tableau Community.
Found a viz that inspires you but aren't sure how it was built?
Tableau Visionary Steve Wexler recommends clicking the download link on a Public viz to see if it’s available for analysis. If it is, you’ll be able to access the workbook and “peek under the hood”.

“Over the years, I’ve downloaded hundreds of workbooks and have analyzed the individual brush strokes of Kelly Martin, Lindsey Poulter, Adam McCann, The Flerlage Twins, and dozens of others. The fact that I can do this so easily is nothing short of amazing. I don’t just get to interact with cool vizzes; I can download them and see how they work!” –Steve Wexler from In Praise of Tableau Public.”
Ways to get and stay connected
Make sure to follow our Featured Authors, Tableau Public Ambassadors, and Tableau Visionaries on Tableau Public. If you get stuck or aren’t sure what to do next to grow your data skills, consider asking these groups for advice or help. The DataFam is ready to help.
Not sure where to get started? Check out this step-by-step guide to begin or grow your data visualization skills with our free platform.
Related Stories

Product Innovations at Tableau Conference 2024
 April 30, 2024
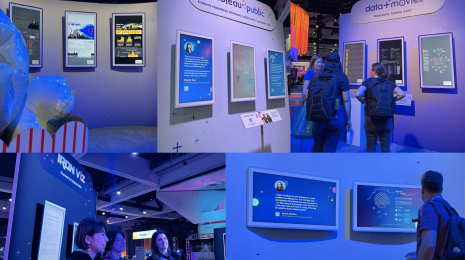
The Tableau Public Viz Gallery at Tableau Conference 2024
 April 29, 2024
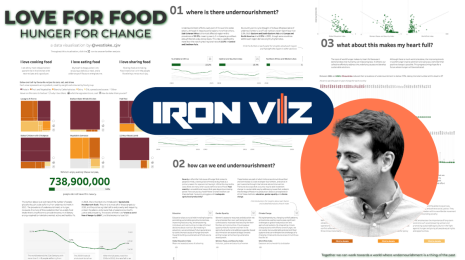
Meet Iron Viz 2024 Finalist Chris Westlake
 April 22, 2024
Subscribe to our blog
Get the latest Tableau updates in your inbox.